Mathematics Project Idea
The Mathematics of a Bridge
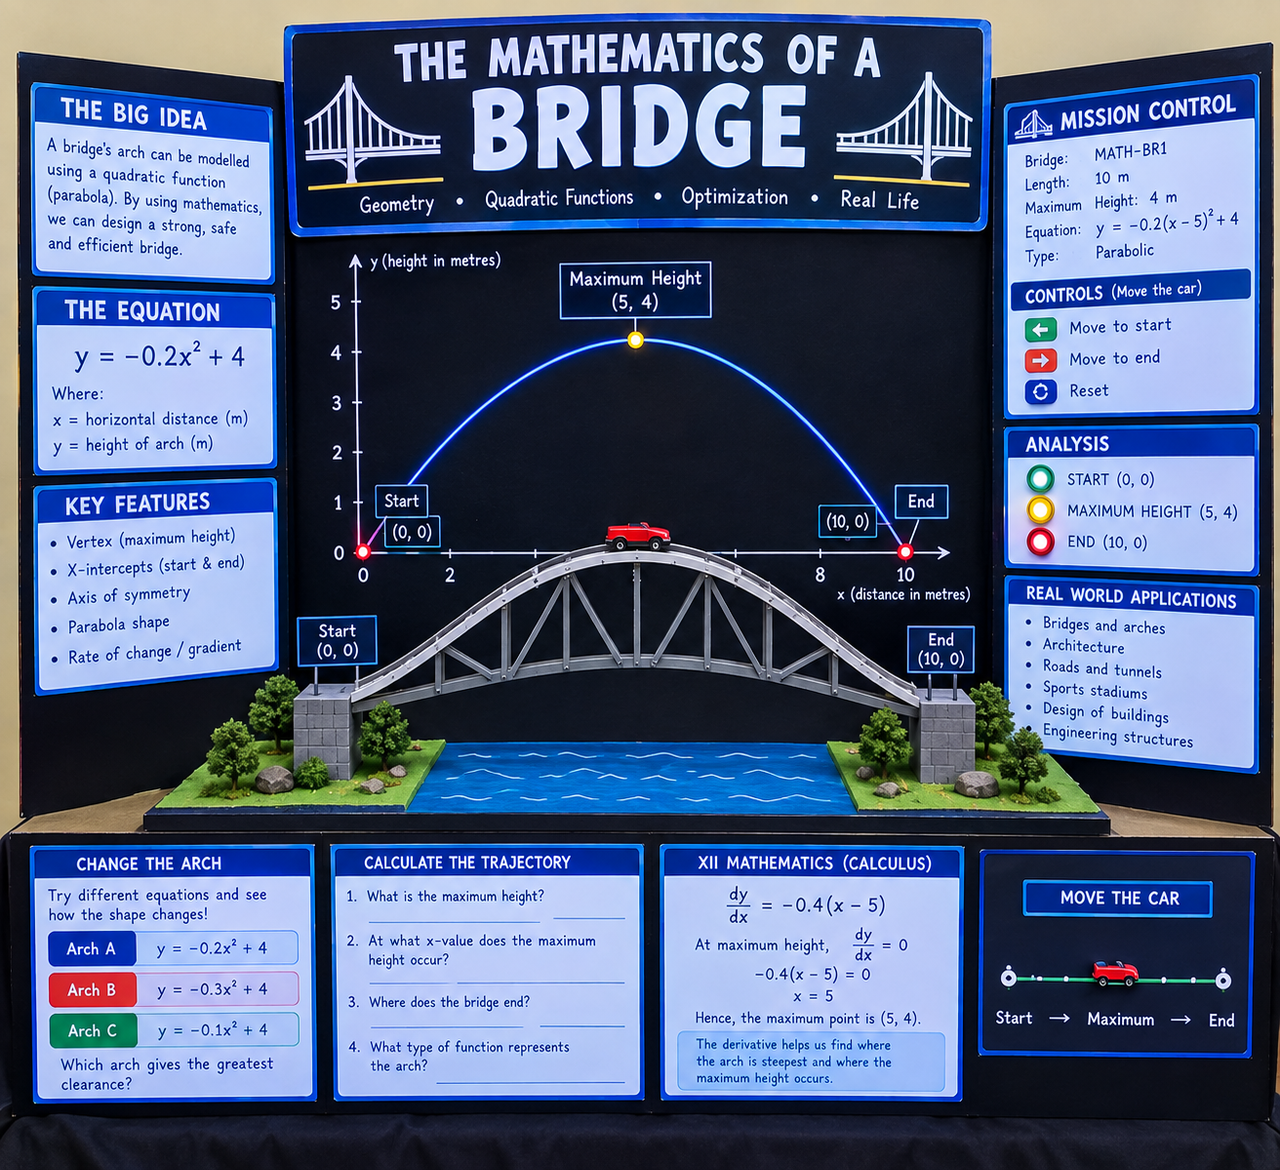
An AI generated detailed explanation and objectives of the project.(Yet to be modified)
1. Main Idea
The central concept of this project is:
A bridge arch can be modelled using a quadratic function, producing a parabola. By using mathematics, we can determine the shape, height, width, and other properties of the bridge and understand how mathematical equations can be applied to real engineering structures.
The project demonstrates that mathematics is not simply a collection of equations written on paper. Quadratic functions, coordinate geometry, graphs, gradients, and calculus can all be connected to something that exists in the real world, such as a bridge.
The physical model will represent a bridge crossing over a body of water, with its main arch shaped according to a quadratic equation.
2. Project Title
THE MATHEMATICS OF A BRIDGE
Possible subtitle: How Quadratic Functions and Calculus Shape Real-World Structures
Other suitable subtitles include:
- From Equations to Engineering
- Understanding Bridge Arches Through Mathematics
- The Parabola Behind the Bridge
- Where Mathematics Meets Engineering
The first subtitle would probably be the strongest for an exhibition.
3. Mathematical Concept
The primary mathematical idea is the quadratic function.
A quadratic function has the general form:
y = ax² + bx + c
Its graph is called a parabola.
For the bridge model, we can use the equation:
y = −0.16(x − 5)² + 4
or, for a simpler equation:
y = −0.2(x − 5)² + 4
The second equation is particularly suitable for an exhibition because it is easy to calculate and explain. This equation represents the shape of the bridge's arch.
4. Why a Quadratic Function?
The bridge arch rises from both ends, reaches a maximum height near the centre, and then falls again. That general shape resembles a downward-opening parabola.
Mathematically:
- The left end represents where the arch begins.
- The centre represents the highest point.
- The right end represents where the arch finishes.
- The highest point is the vertex of the parabola.
- The line through the centre is the axis of symmetry.
Therefore, the equation provides a mathematical model of the bridge. This allows students to calculate important dimensions rather than simply constructing an arch by guesswork.
5. Example Bridge Dimensions
For the exhibition model, we can define:
- Bridge length: 10 m
- Maximum arch height: 4 m
- Starting point: (0, 0)
- Ending point: (10, 0)
The equation can be: y = −0.16(x − 5)² + 4
Verification of important points:
-
At
x = 5:y = −0.16(5 − 5)² + 4 = 4→ (5, 4) (Maximum Point) -
At
x = 0:y = −0.16(0 − 5)² + 4 = −4 + 4 = 0→ (0, 0) (Start Point) -
At
x = 10:y = −0.16(10 − 5)² + 4 = 0→ (10, 0) (End Point)
6. What the Exhibition Model Would Show
Main Physical Model
At the centre will be a miniature bridge including:
- Two supporting sides
- A curved/parabolic arch
- A road surface
- Small toy vehicles
- Water underneath
- Small trees or buildings
- Structural supports
- Labels showing mathematical points
7. The Main Mathematical Display
Behind or above the bridge, place a large coordinate graph
showing the parabola representing the bridge:
y = −0.2(x − 5)² + 4
The graph can contain three important labelled points:
- Start: (0, 0)
- Maximum Height: (5, 4)
- End: (10, 0)
8. Vertex & 9. Axis of Symmetry
Vertex: The highest point (5, 4).
x = 5 m is horizontal position,
y = 4 m is max height.
Axis of Symmetry: x = 5. The left
and right sides are mirror images.
10. X-Intercepts
Setting y = 0 determines where the parabola meets
the ground level at x = 0 and x = 10.
11 & 12. Calculus Section
Differentiating y = −0.2(x − 5)² + 4:
dy/dx = −0.4(x − 5)
At maximum height, dy/dx = 0 ⇒
−0.4(x − 5) = 0 ⇒ x = 5,
y = 4.
“The derivative helps us determine where the arch reaches its maximum height.”
13 & 14. Interactive Element
A manual slider with a small toy car attached to a thread moves along the bridge: START (0,0) → MAXIMUM (5,4) → END (10,0), directly linking physical position to coordinates.
15. “Change the Arch” Demonstration
-
Arch A:
y = −0.16(x − 5)² + 4 -
Arch B:
y = −0.12(x − 5)² + 4 -
Arch C:
y = −0.20(x − 5)² + 4
Demonstrates how changing the coefficient a alters
the height and width of the parabola.
20. Mathematical Topics Covered
- Coordinate Geometry: Coordinates, Distance, Graphs, Intercepts
- Quadratic Functions: Parabolas, Vertex, Axis of symmetry, Max/min values
- Algebra: Expanding brackets, Substitution, Solving equations
- Calculus: Differentiation, Gradients, Stationary points
22. Suggested Board Layout
 ---------------------------------------------------------
|                  THE MATHEMATICS OF A BRIDGE            |
|       How Quadratic Functions Shape Real Structures     |
 ---------------------------------------------------------
| THE BIG IDEA |          MAIN GRAPH          | MISSION    |
| Explanation  |       Parabolic arch         | CONTROL    |
| EQUATION     |         BRIDGE MODEL         | ANALYSIS   |
 ---------------------------------------------------------
| CHANGE THE ARCH | CALCULATE THE TRAJECTORY | CALCULUS   |
 ---------------------------------------------------------